
For every digital marketing agency, Google Analytics (GA) is a must-have tool for tracking website performance and information on consumer behaviour. With the creation of Google Analytics 4 (GA4), marketing agencies are empowered to collect more robust information thanks to its event-based tracking version and enhanced privacy functions. However, mastering GA4 can be daunting, mainly if you’re acquainted with the older version, Universal Analytics.
Universal Analytics offered insights like:
- Bounce Rate – The percentage of visitors who leave after viewing just one page without interacting further.
- Pageviews – The total number of pages viewed, counting multiple views of the same page.
- Sessions – When a user actively engages with your site or app.
- Unique Visitors – The number of individual users visiting your site, no matter how many times they return.
These are just a few of the key stats Universal Analytics tracked. While GA4 still includes these metrics, it measures them a bit differently.
Starting July 1, 2023, GA4 became the default analytics platform, and Universal Analytics stopped collecting new data. However, you’ll still be able to access old data from Universal Analytics, but no new data will be tracked after June 30, 2023.
How to Adjust GA4’s Prebuilt Reports to View the Data You Need
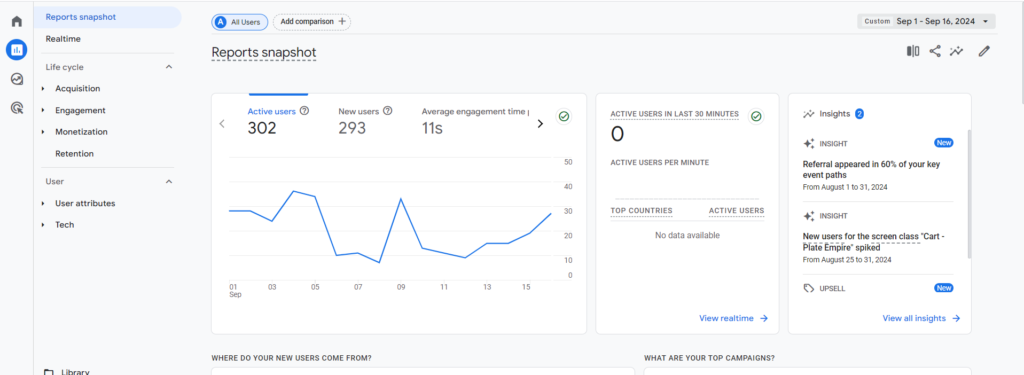
GA4’s Reports menu has some useful reports to get started with, but they can be a bit tricky to navigate. The charts at the top aren’t always helpful, and the table below can be too small to view comfortably. However, you can make these reports more effective with a few tweaks. Here’s how to do that.
Log in to Google Analytics, head to Reports > Pages, and let’s explore some ways to explore the data more deeply.
1. Using Comparisons
You can compare data based on different dimensions to get more specific insights. For example, you can see which pages were visited by users who came from organic search and those who came from organic social.
- Click Add Comparison at the top of the report.
- Select the dimension Session source/medium, set it to “exactly matches,” and enter Google / organic.
- Click Apply.
- Then, repeat the steps to add a comparison for organic social.
It will give you a side-by-side comparison of how different sources drive traffic to your pages.
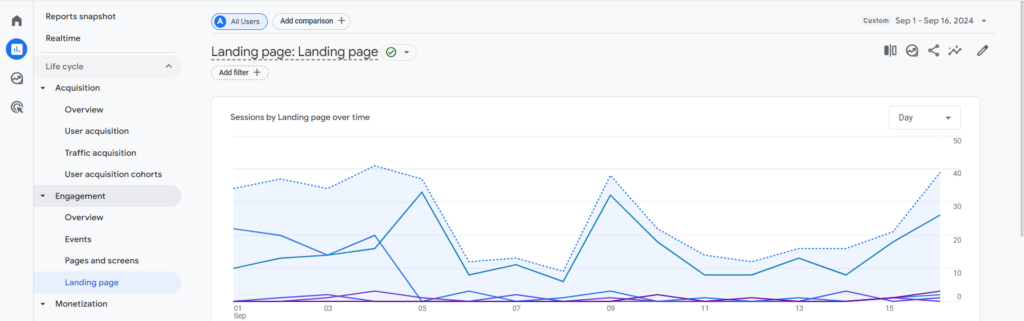
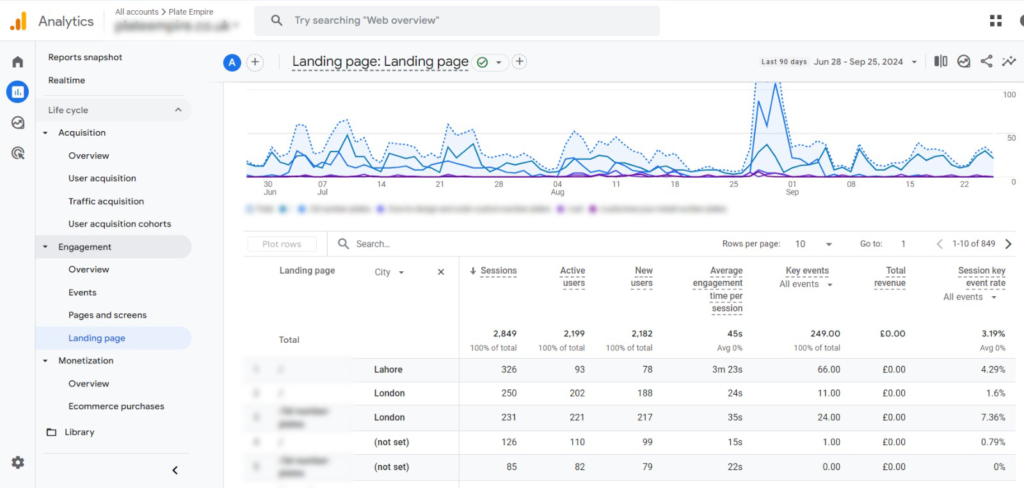
2. Adding More Details to Your Table
You can add a secondary dimension to your table to view more detailed data. For instance, you might want to see the number of page views for each source/medium.
- Click the plus (+) button next to the column header that says “Page path.”
- Add Session source/medium as a secondary dimension.
It will give you a clearer view of where your traffic is coming from for each page.
3. Comparing Data Across Different Date Ranges
You can also compare data from different time periods. Use the date control to select two date ranges, and you’ll be able to see how your data compares over time.
4. Using Filters
Filters help narrow down your data. You can use the search box above the data table to find a specific page or a group of pages (like all pages in your blog directory).
It is also useful for checking when a new page went live or when a new event started tracking. Just search for the page or event in the report, and the chart will show when it began receiving traffic.
Additionally, you can filter data by traffic source, location, or demographics:
- Click Add Filter near the title of the report.
- Filter by criteria like traffic source, geography, or demographics.
For example, you can see which pages were visited by users in a specific location, such as those who attended a recent trade show.
5. Questions You Can Answer Using GA4 Reports
You can answer various questions about your website’s performance with comparison and filter options. Here are a few examples:
- Which pages started getting traffic after a new page went live?
- Which sources drive the most traffic to a specific landing page?
- Which subdirectory pages have the highest engagement rates?
- What websites are sending referral traffic?
- What are the top product pages viewed by users in a particular state?
- What was the engagement rate for visitors from the August and July newsletters?
- Which blog posts are most popular among male vs. female visitors?
- What’s the top traffic channel for important events on your site?
These examples can help you get more out of GA4’s reports.
Deep knowledge of GA4 capabilities can be valuable and open new opportunities in analyzing data and making decisions for businesses. Nevertheless, it is not always easy to understand GA4 and make the best of it if you have been using Universal Analytics. At this strategic point, an independent digital marketing or performance marketing agency such as Cut N Cue Media can help. Our experience in data-driven marketing strategies assures you that you are fully optimizing your analytics by transforming your data into insights, translating into business growth. As businesses seek to perform in the digital environment, based in Lahore, Cut N Cue Media emerges as the ultimate ally for analytics and portfolio for successful marketing in the region.
Happy exploring!